This page has statistics, links and news releases about Yosemite valley flooding, spring runoff and snow pack/ snow water content for various years.
See also: How much water will there be in the Yosemite waterfalls?
Read Naturalist John Muir on Winter Storms and Spring Floods, Snow-storms, and Snow Banners
in his book The Yosemite at:
http://www.gutenberg.org/ebooks/7091
————– – – – – – – – – – – – ————–
When will Yosemite high elevation roads, the Glacier Point Road and Tioga Road be open?
The amount of snowpack and the temperature in April and May, will affect when the Tioga road up to and beyond Tuolumne meadows and the Glacier Point Road to Washburn Point and Glacier Point are plowed and open. The Park service notes: “Predicting when these roads will open is not possible, even in late spring, because weather in April and May can affect plowing progress significantly.” When the roads open has a corresponding effect on when the high country campgrounds and High Sierra Camps can open.
Tioga road opening (anywhere from April 29 to July 1, but most often in May) and closing (from Oct. 17 to Jan. 17, but most often in November) dates are at: https://www.nps.gov/yose/planyourvisit/seasonal.htm
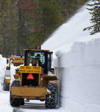
below: a NPS photo of the Tioga road in early May, 2005
Glacier Point Road openings have been from April 14 to to July 1 (most often in May) and closings have been Oct. 31 to Dec. 12 ( most often in November).
And see: https://www.nps.gov/yose/planyourvisit/seasonal.htm
Watch a video of plowing (it is potentially dangerous, they have an ambulance on site)
https://www.nps.gov/media/video/view.htm?id=F99C47BC-DA5D-5DB6-9B080585218403F4
The NPS had this note about the process of opening the Tioga road, then the Tuolumne facilities:
“Once the Tioga Road opens, crews begin working in campgrounds and other facilities to prepare them for opening. Before campgrounds can open, crews assess the condition of the campgrounds, remove hazard and fallen trees, make emergency road repairs, de-winterize restrooms, pump vault toilets, and turn on and test water systems. Additionally, sewer and utility systems often need repair each spring.
All this work also has to happen at visitor centers, offices, residences, and other facilities, as well. Opening offices and residences for staff are a high priority because campgrounds and other facilities need staff in order to operate.
As a result, campgrounds usually don’t begin opening until at least two to four weeks after the Tioga Road opens.”
________________________________________________
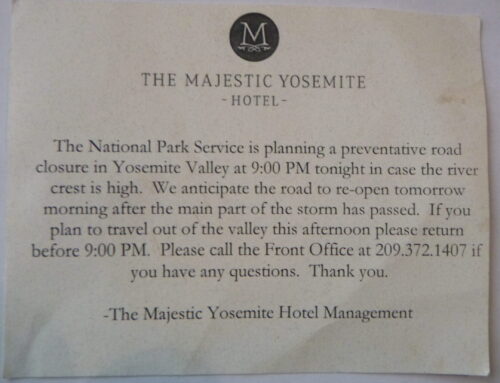
A hotel guest might find a note slipped under their room door:
________________________________________________
The locations of film footage are labeled in each of these videos (courtesy of the National Park Service)
Here is a video of floods in 1996 and 1997, :
and see 2017 flooding:
and 2018 flooding:
What happens when Yosemite valley begins to flood?
from a Yosemite Alert of April 25, 2023:
“Most of Yosemite Valley will close starting Friday, April 28, at 10 pm, due to a forecast of flooding. This closure will last until Wednesday, May 3—possibly longer. Additional flooding and closures may occur later in May or June. Reservations for lodging and campgrounds in eastern Yosemite Valley will automatically be canceled and refunded. Wilderness permits can be rescheduled to alternate trailheads as space allows.
During this closure, Wawona, Mariposa Grove (via hike only), Crane Flat area, Hetch Hetchy, and western Yosemite Valley will be open. In Yosemite Valley, the closure will be at El Capitan crossover (the road that crosses the Merced River just east of El Capitan). There will be no visitor access (including pedestrian access) east of that road. Parking in western Yosemite Valley and throughout the park will be extremely limited. Do not park off road. No services will be available in western Yosemite Valley.”
Followed by another Alert on April 29, 2023:
“The river did not rise as much as forecast, so Yosemite Valley will be open Sunday from 7 am to 8 pm for day-use only with very limited services. The only concession services available in Yosemite Valley will be the Village Store, Village Grill, and Degnan’s Kitchen.
Yosemite Valley will then reopen fully on Monday at 7 am.
Rivers are running very high and are extremely dangerous. Do not go into or even approach rivers in Yosemite.”
Below, a chart of Merced River gage height at Pohono Bridge April 25 to May 1 2023:
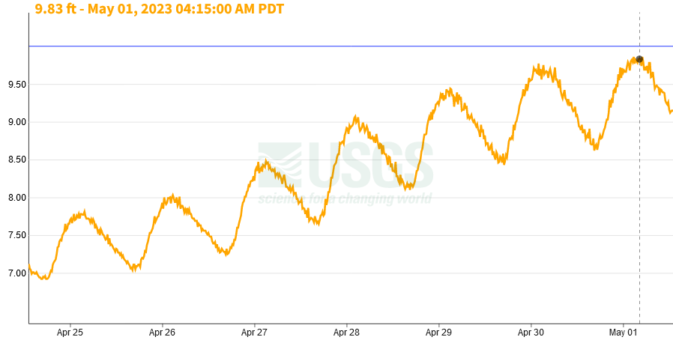
https://waterdata.usgs.gov/monitoring-location/11266500/
And in early/mid may 2023:
“Yosemite National Park is open. However, Housekeeping Camp and Lower and North Pines Campgrounds are closed. Additional closures are possible. We plan to announce any additional closures two days in advance.”
from a California Emergency Digital Information Service warning email, June 16, 2011 and June 23, 2011:
WARM TEMPERATURES WILL CONTINUE TO CA– USE SNOWMELT TODAY AND THE MERCED RIVER AT POHONO BRIDGE WILL REACH FLOOD STAGE AGAIN LATE TONIGHT… * AT 8:00 AM THURSDAY THE STAGE WAS 10.2 FEET. * FORECAST TO RECEDE TO 9.2 FEET THURSDAY AFTERNOON THEN RISE TO 10.0 FEET AROUND 3 AM FRIDAY. * FORECAST TO RECEDE TO NEAR 9.0 FT FRIDAY EVENING THEN FORECAST TO FLUCTUATE NEAR 9.5 FT THRU SATURDAY MORNING. * FLOOD STAGE 10.0 FT * …
NEAR 10.5 FEET, WATER TOPS THE SWINGING BRIDGE DOWNSTREAM FROM CHAPEL MEADOW. OVERFLOW FROM WOSKI POND FLOODS ACCESS ROAD(NORTHSIDE DRIVE) LEADING OUT OF THE WEST ENTRANCE OF THE PARK. *
NEAR 10.0 FEET, WESTERN PORTION OF NORTH PINES CAMPGROUND… LOCATED AT THE EAST END OF YOSEMITE VALLEY BETWEEN THE CONFLUENCE OF THE MERCED RIVER AND TENAYA CREEK… BEGINS TO FLOOD. WATER RISES TO THE BASE OF THE SWINGING BRIDGE DOWNSTREAM FROM CHAPEL MEADOW.
NEAR 9.5 FEET PORTION OF LOWER PINES CAMPRGOUND BECOMES FLOODED. LIMITED SITE-SPECIFIC EVACUATIONS BEGIN AT HO– USEKEEPING CAMP LOCATED ALONG THE SOUTH-FACING BANK OF THE MERCED RIVER (UPSTREAM FROM SENTINEL BRIDGE AND DOWNSTREAM FROM STONEMAN BRIDGE).
NEAR 9 FEET, CHAPEL MEADOW (SOUTH SIDE OF RIVER) AND COOKS MEADOW (NORTH SIDE OF RIVER) BEGINS TO EXPERIENCE OVERFLOW.
NEAR 6.5 FEET RIVER IS CLOSED TO RAFTERS AND FLOTATION.”
One year we were lucky enough to be camping during very high water flow and visitors were warned that they needed to be prepared to evacuate on four hours notice, quite probably in the middle of the night. The park closed to incoming people and only visitors who were already there got to witness the magnificent waterfalls.
—————————-
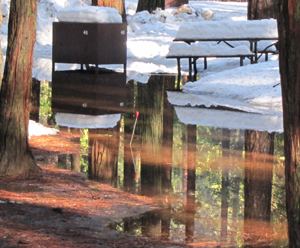
When it starts to flood, as in this February 2017 photo, a seasonal temporary creek in Upper Pines campground totally floods some campsites, or even loops of campsites:
—————————-
More What Happens during Yosemite Valley Flooding? from news releases:
From January 2017 flooding:
Jan. 7 “Yosemite Valley is now closed due to forecast high river flows in the next 48 hours. Residents have been evacuated, all entry and exit is prohibited. . .
“The latest river forecast is calling for a peak at 18.4 feet in Yosemite Valley on Sunday at 4 pm.”
Jan. 8
“The latest river forecast is calling for a peak at 11.8 feet (1.8 feet above flood stage) in Yosemite Valley tonight at 10 pm. Flood waters are expected to recede to a level below flood stage by 6 am on Monday, January 9” . . .
“Yosemite Valley residents may return home on Monday, January 9. Gates will be opened at 10 am. Closure remains in effect for visitors until further notice.”
Jan. 9
“The Merced River peaked at 12.68 feet overnight and was at 11.8 feet at 9 am. The South Fork Merced River peaked just under 10 feet. The latest river forecast is calling for river stage to get below 10 feet (flood stage) around 1 pm, however, this forecast doesn’t account for the effects of the El Capitan Moraine, which slows outflow from Yosemite Valley. . .”
“The sewer system is near capacity right now due to floodwater infiltration. This should resolve as flood waters recede. We are waiting for this to occur before allowing additional people into Yosemite Valley, since more people in the Valley will cause the sewer system to exceed its capacity. . .There are no known issues with flooding at residences, however, we are continuing assessments. Flooding did occur at the concession security office and garage area due to overflow from Indian Creek. . . Rivers and creeks are running high and fast. Use extreme caution around any flowing water.”
From February 9, 2017:
“The current river forecast for the Merced River is calling for a peak of 9.5 feet at 5 am on Friday morning. While this is lower than the nearly 11-foot peak last night, there’s some uncertainty with the river forecast. If the snow level remains high, the river could peak at over 13 feet.
Given the uncertainty, employees who commute to Yosemite Valley should not plan on arriving to the Valley prior to 9 am. Please work with your supervisor to identify an alternative work location or work schedule for tomorrow. Conditions will be reassessed in the early morning and a new update will come out on Friday morning around 7 am.
Yosemite Valley residents are encouraged to reduce their water usage during the peak flow of this storm in order to reduce impacts on the water and wastewater utility system. Residents are also encouraged to avoid driving around the Valley tomorrow morning as a safety precaution.”
————– – – – – – – – – – – – —————
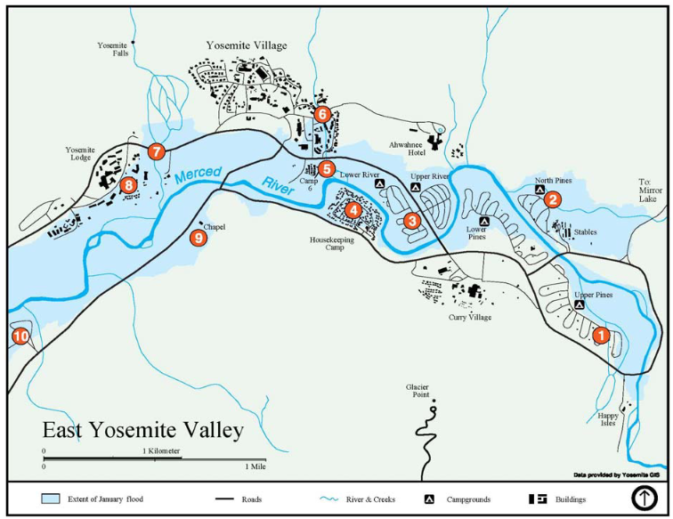
Below, a Park Service map of the extent of flooding in east Yosemite Valley during the January 1997 flood:
————– – – – – – – – – – – – —————
From a park webpage, in anticipation of Spring crowds and needed roadwork, patience is advised:
“Valley Roads and Parking, Spring 2017
Heavy winter rains and snow are affecting on-going road improvement projects in
Yosemite Valley, resulting in road closures and detours. Visitors arriving this spring in personal vehicles and buses may encounter delays, congestion, and detours. One-
way roads may become two way, and vice versa; pay attention to road signs. Road segments may close to prevent gridlock when areas of the park become congested.
Printed and online maps may not reflect current road conditions.
With anticipated high-flowing waterfalls, late openings for Tuolumne Meadows and Glacier Point due to snow, and the Mariposa Grove closed for restoration, expect crowded conditions in Yosemite Valley this spring. Being prepared for significant traffic, especially on weekends and holidays, will help result in a more enjoyable visit to Yosemite National Park.” See also Yosemite traffic and day use parking tips.
————- – — – – – – – —- – —————–
And a report after April, 2018 flooding, again when the valley was closed to visitors,
“Yosemite Valley Flood Narrative
On April 7th, Yosemite Valley experienced the 8th largest flood recorded at Pohono Bridge since 1917, the largest flood in 21 years. The Merced River peaked at Pohono Bridge at 6:15pm at 13.73 feet, flowing at 12,200 cubic feet per second (cfs). Upstream at the gage at Happy Isles, the Merced River peaked at 3:45pm at 10.09 feet, flowing at 8,000 cfs, which was the 6th largest on record at this gage since 1916. During the river’s peak, more than 60% of the river’s flow entered Yosemite Valley at Happy Isles, with the rest coming mainly from the numerous tributaries flowing into the valley. At Pohono Bridge, flood conditions occurred for nearly 30 hours, rising above 10 feet on April 7 at 08:00am and dropping below 10 feet on April 8 at 1:45pm. Floodwater inundated roads at numerous places, water depths ranged 2 – 4 feet at Chapel Meadow, Wosky Pond, Sentinel Cross, and El Cap Cross.
The flood resulted from an unusual Spring atmospheric river of warm precipitation falling on a saturated snowpack and saturated soils. With the snowline higher than 12,000 feet, most of the precipitation falling in the Tuolumne and Merced River watersheds fell as rain. This combination of preexisting conditions and high snowline led to rapid runoff from most of the watershed area, generating flooding with only 2 – 4 inches of precipitation. This scenario differs from typical winter storms when the snowline is lower and a much smaller area of the watershed is contributing runoff.
Interestingly, during rain-through-snow events it is generally thought that rain contributes most of the runoff, while smaller amounts of runoff are contributed by melted snow. However, during this storm, snow sensors in Yosemite measured larger amounts of snowmelt, in some places possibly doubling the amount of runoff. The amount of rain during the event ranged 2 – 4 inches, while snowmelt ranged 0.7 – 4.3 inches of liquid water. During the afternoon of April 7, winter rangers in Tuolumne Meadows observed the Tuolumne River melting out rapidly, which was last observed during the historic flood of 1997. We are still investigating why such a large amount of snowmelt occurred. (H. Forrester)
————- – – – – – – – – – – – —————–
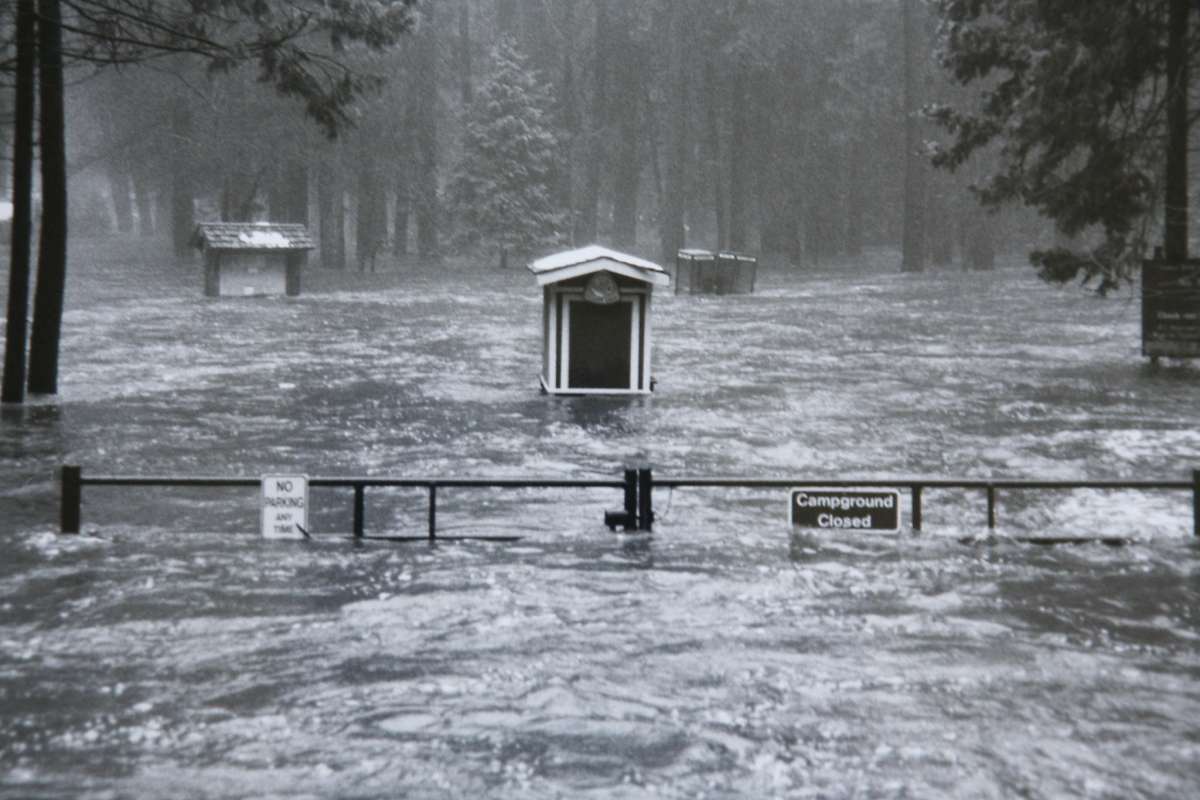
A park service photo of the entrance to lower pines campground during the historic flood of 1997:
and notes on the
25th Anniversary Of The 1997 Flood
“January 2 (2022) marks the 25th anniversary of the 1997 flood in Yosemite Valley, the most damaging flood in Yosemite’s recorded history.
In the first few days of 1997, an unusual storm pushed a band of warm, moist air inland from the Pacific Ocean causing widespread flooding throughout Yosemite Valley. Over the course of a week rainfall totals surpassed 20 inches, with rain falling as high as 9,200 feet elevation. When the snow line elevation rises, even a small amount, there is a drastic increase in the total drainage area that receives rain, like the storm that triggered the 1997 flood. Rapid runoff of this intense rain and melting snow caused the Merced River to swell to a record-setting crest of 14 feet above flood stage (24,600 cubic feet per second), the highest river flow measured in nearly a century.
Roads and bridges in Yosemite Valley were washed out, leaving more than 2,000 visitors and employees temporarily stranded in Yosemite Valley. Half of Yosemite’s 900 campsites were flooded, as well as guest rooms and employee cabins at the Yosemite Lodge. Electrical, water, and sewer systems were destroyed. Yosemite Valley was closed to the public for over two months while the extensive infrastructure damage was repaired and replaced.
Following the flood, the National Park Service took steps to reduce the impact of future floods, including moving non-essential infrastructure out of flood-prone areas and making the essential infrastructure more resilient. Flood forecasts have improved considerably, allowing the National Park Service to be better prepared for large floods.
The 1997 flood was similar in size to the “100-year flood” in Yosemite Valley—a flood with an approximately 1% chance of occurring each year. However, as the climate warms, warm winter storms that drop rain rather than snow, like the one that caused the 1997 flood, will become more frequent, increasing the likelihood that severe floods will occur more frequently.
Although the 1997 flood negatively affected human infrastructure in Yosemite Valley, flooding is a natural process essential to the functioning of many ecosystems. Flood waters deliver organic matter and vital nutrients to the surrounding floodplain and improve wildlife habitat.” (Yosemite park geologist Greg Stock)
————- – – – – – – – – – – – —————–
Yosemite Snow Surveys tell us how much snow there is in the main drainages (melting snow and rain being the main sources of water for wateralls, rivers) in Yosemite.
The Merced river drainage mentioned below is the water for the Little Yosemite Valley waterfalls, such as Vernal Fall, Nevada Fall and Bunnell Cascade.
Tuolumne River drainage “includes the higher elevation areas of Tioga Road”.
(from the Yosemite Daily Report May 5, 2026) The final snow survey of the season was completed in the May 1st window. The Merced drainage is 20% and Tuolumne drainage is 25% of May 1 average.
Weekend Storm Update (from the Yosemite Daily Report April 14, 2026)
Over the weekend (April 10-12) a storm series generated extensive rain and snowfall in Yosemite. Around 1.5 – 2.5 feet of new snow accumulated in areas of the park above 6000ft, with slightly more accumulation in the northern regions of the park. Yosemite Valley recorded 2.5 new inches of total precipitation during the storm (rain + snow).
Overall, the deepest snowpack recorded in the park is currently in the north at the Slide Canyon weather station, with a total snow depth of 4.5 feet. In Tuolumne Meadows, the total snow depth is around 1 foot, and near Tioga Pass it is about 3 feet. (R. Hallnan)
Winter 2026 Recap + Early Snowmelt and Runoff (from the Yosemite Daily report April 6, 2026)
This winter in Yosemite was mostly warm and dry, interrupted by a few major storms around Christmas, New Year’s, and President’s Day. A record March heatwave drove early and rapid snowmelt, with persistent above‑freezing temperatures causing sharp snow declines in SWE—the amount of liquid water contained in snow—at all Yosemite stations. Snowpack peaked in late February to early March—about a month earlier than the usual April 1 peak—and has since dropped 40% at higher elevations and up to 100% at lower ones. Snow depths are now less than 3 feet almost everywhere, with losses of 2–4.5 feet since late February.
The Merced River at Pohono Bridge reached a potential season peak of 2,930 cubic feet per second on March 21. While another peak may occur as temperatures warm through April, limited high‑elevation snow remains to drive higher flows. A snowmelt runoff peak in March would be the earliest recorded on the Merced River in Yosemite Valley (the second earliest, in 1939, was a full month later). While small weather systems in early April offer some brief relief, the March heatwave, rapid snowpack loss, and early runoff are exceptional in Yosemite’s historical record. (R. Hallihan)
Storm Snowfall Totals – Feb 15-18th, 2026
The latest storm brought around 18 inches of snow to Yosemite Valley, while the park saw surprisingly consistent increases in snow depth in the park’s mid-elevation 7,000-9,000ft band. Tuolumne Meadows, White Wolf, Gin Flat, and Ostrander all received around 40 inches of new snow. At these sites, the total accumulated snow depth ranges from a low of 56 inches at Gin Flat to 91 inches at Tenaya Lake. The Central Sierra has now received 111% of average precipitation for this date (both rain and snow), and total snowpack is around 70% of average.
Final Snow Survey Results (as reported May 7, 2025)
Park staff have completed the final snow surveys for the year, sampling 13 sites throughout the Merced and Tuolumne watersheds. Percentages of water content found the Merced at 62% and Tuolumne of 55% of average.
Monthly Snow Survey Data as reported April 4, 2025
Park staff have recently completed the monthly snow surveys across 13 sites. The Tuolumne Drainage is 72% and Merced Drainage is 75% of average for April 1st. With a warm winter, these averages are being brought down by the lower elevation snow courses which received more rain than usual earlier this winter. These surveys were completed before the early April storms.
March 1, 2025 snow survey
“The Tuolumne Drainage is 66% and Merced Drainage is 57% of average for March 1st. These surveys were completed before the last storm cycle.”
February 1, 2025 snow survey
“Park staff have completed the February 1st Snow Surveys for the State of California Department of Water Resources. In both Tuolumne and Merced drainages, 14 courses are surveyed 4 months of the year. The first of the year’s surveys report the Merced at 25% of April 1st average, and the Tuolumne at 29% of April 1st average. These surveys were completed in advance of the most recent storms.”
April 1, 2024 snow survey
“Park staff completed the April 1st Snow Surveys just before the last storm. The measurements found the Merced drainage at 91% and Tuolumne drainage at 99% of average April 1st snowpack.”
March 1, 2024 snow survey
“Park staff completed March 1 Snow Surveys, before the weekends significant storm event. Measuring 6 locations in Merced drainage and 17 locations in Tuolumne drainage, results show 63% of April 1 average for the Merced and 73% of April 1 average for Tuolumne.”
Snow Survey reported in early May, 2023:
“The final snow surveys for the 22-23 season have been completed by park staff. The Merced drainage is 231% of average (and 189% of April 1 averages). The Tuolumne drainage is 253% of average (and 207% of April 1 averages). It has been a remarkable snow season—thanks to staff in Interpretation, Resources, Protection, BRM, and partners from YC and UC Merced for help completing these important data sets.”
April 1, 2023 Snow Survey
“The Tuolumne Drainage basin average was 244% and the Merced Drainage basin average was 241%. The surveyors determined that at many sites, especially those between 8000-9000ft, this was the deepest snow on record for April 1st measurements. Park staff will complete the final snow survey for the year next month.”
Snow Survey reported in early March, 2023:
“Amidst the incredible storms, snow surveys for the month have been completed. Sampling this month’s window was incredibly challenging, and not all sites were able to be surveyed this month. The Tuolumne Drainage was measured at 186% of average, and Merced Drainage was measured at 160% of average.”
A link in the Yosemite snow survey report to https://cdec.water.ca.gov/reportapp/javareports?name=COURSES (“Data are preliminary and subject to revision.”) showed that Tenaya lake had 142% of normal and Tuolumne Meadows had 192% of normal. (At Lake Tahoe, the Upper Truckee measurement had 358% of normal. At Mammoth it was 224%. The statewide average was 185%.)
First Snow Surveys of 2023 reported in early February.
The Merced River Drainage is at 207%, and Tuolumne River Drainage is at 200% of average for the month of February. Snow Surveys are sampled in 14 locations throughout the park and data is provided to the Department of Water Resource for the State of California.
May, 2022 Snow Survey Results
The Merced Drainage is at 33% and Tuolumne Drainage is at 31% of average snow depth and water content.
April 1, 2022 Snow Survey Results
The water content of the snowpack in both Merced and Tuolumne drainages registered at 41% of average.
March 1, 2022 Snow Survey Results
The water content of the snowpack in the Tuolumne drainage is 65% of average; in the Merced drainage it is 64% of average.
February 1, 2022 Snow Survey Results
The water content of the snowpack in the Tuolumne drainage is 96% of average; in the Merced drainage it is 92% of average.
May 1, 2021 Snow Survey Results
Water content for the Tuolumne drainage is at 25% of average, and at 31% of average for the Merced drainage.
April 1, 2021 Snow Survey Results
Water content for the Tuolumne drainage is at 63% of average, and at 64% of average for the Merced drainage.
March 1, 2021 Snow Survey Results
The water content of the snowpack in both the Merced and Tuolumne drainages is 67% of average.
May 1, 2020 Snow Survey Results
The water content of the snowpack in the Tuolumne drainage is 41% of average; in the Merced drainage it is 54% of average.
April 1, 2020 Snow Survey Results
The water content of the snowpack in the Tuolumne drainage is 46% of average; in the Merced drainage it is 49% of average.
March 1 2020 Snow Survey Results
The water content of the snowpack in the Tuolumne drainage is 34% of average; in the Merced drainage it is 38% of average.
February 1, 2020 Snow Survey Results
The water content of the snowpack in the Tuolumne drainage is 68% of average; in the Merced drainage it is 59% of average.
May 1, 2019 snow survey results
The water content of the snowpack in the Tuolumne drainage is 149% of average; in the Merced drainage it is 160% of average.
April 1, 2019 Snow Survey Results
The water content of the snowpack in the Tuolumne drainage is 176% of average; in the Merced drainage it is 153% of average. The storms this year were colder than in recent years, with a deep snowpack at lower elevations. At 7,000 feet, for instance there is approximately 8 feet of snow.
March 1, 2019 Snow Survey Results
The water content of the snowpack in the Tuolumne drainage is 147% of average; in the Merced drainage it is 151% of average.
February 1, 2019 Snow Survey Results
The water content of the snowpack in the Tuolumne drainage is 110% of average; in the Merced drainage it is 93% of average.
May 1, 2018 Snow Survey Results The water content of the snowpack in the Tuolumne drainage is 40% of average; in the Merced drainage it is 39% of average.
As of April 25, 2018 there was no report yet in the Yosemite Daily Report of the April 1, 2018 snow survey results, but this was at http://cdec.water.ca.gov/cgi-progs/reports/COURSES.201804
Tuolumne River Basin
157 Dana Meadows 9,800 26-MAR 76.5 20.0 26% 30.1 66%
158 Rafferty Meadows 9,400 28-MAR 75.0 23.0 31% 32.5 71%
159 Bond Pass 9,300 27-MAR 111.5 29.5 26% 43.7 68%
368 New Grace Meadow 8,900 31-MAR 109.5 42.0 38% 46.6 90%
161 Tuolumne Meadows 8,600 25-MAR 44.5 13.5 30% 22.3 61%
162 Horse Meadow 8,400 27-MAR 100.0 32.5 32% 45.8 71%
163 Wilma Lake 8,000 31-MAR 85.5 35.0 41% 42.9 82%
165 Sachse Springs 7,900 29-MAR 48.5 19.5 40% 36.7 53%
164 Spotted Fawn 7,800 29-MAR 75.0 30.0 40% 44.8 67%
166 Huckleberry Lake 7,800 28-MAR 77.0 30.5 40% 40.4 75%
167 Paradise Meadow 7,650 30-MAR 58.5 23.0 39% 38.6 60%
348 Kerrick Corral 7,000 31-MAR 34.0 14.5 43% 23.0 63%
169 Vernon Lake 6,700 29-MAR 31.0 13.0 42% 21.6 60%
173 Lower Kibbie 6,700 30-MAR 29.5 12.5 42% 24.2 52%
168 Upper Kibbie Ridge 6,700 30-MAR 21.0 10.0 48% 17.8 56%
171 Beehive Meadow 6,500 29-MAR 34.0 16.0 47% 22.2 72%
172 Bell Meadow 6,500 31-MAR 23.0 10.5 46% 14.8 71%
Basin Average Pct. of April 1: 67%
Merced River Basin
176 Snow Flat 8,700 29-MAR 82.0 31.5 38% 44.2 71%
177 Ostrander Lake 8,200 29-MAR 56.0 24.0 43% 33.6 71%
178 Tenaya Lake 8,150 31-MAR 44.0 17.5 40% 31.8 55%
179 Gin Flat (Course) 7,000 30-MAR 40.0 17.0 42% 31.1 55%
180 Peregoy Meadows 7,000 30-MAR 33.5 14.0 42% 27.7 51%
Basin Average Pct. of April 1: 61%
March 1, 2018 Snow Survey Results
The water content of the snowpack in both the Tuolumne drainage and the Merced drainage is is 20% of average. Nineteen out of twenty snow courses were sampled before the recent storm.
February 1, 2018 Snow Survey The water content of the snowpack in the Tuolumne drainage is 25% of average; in the Merced drainage it is 16% of average.
May 1, 2017 snow surveys. The water content of the snowpack in the Merced drainage is 201% of average. The water content of the snowpack in the Tuolumne drainage is estimated at 167-180% of average. The snow pack is heavily weighted toward the higher elevations, with many courses over 200% of their May 1 average.
April 1, 2017 snow surveys. The water content of the snowpack in the Tuolumne drainage is 177% of average; in the Merced drainage it is 168% of average. The snow pack is heavily weighted toward the higher elevations. Below 7,500′ the snow is deep but not exceptional; 143% of average across the park. Above 8,500′ the water content of the snowpack is the highest on record. The snow on the high elevation courses is 10-14 feet deep and contains 5-7 feet of water.
March 1, 2017 snow surveys. The water content of the snowpack in the Tuolumne drainage is 208% of average; in the Merced drainage it is 177% of average. Several courses established new records for both depth and water content. The snowiest course in the park is Grace Meadow, with 16 1/2 feet of snow and over 7 feet of water content.
May 1, 2016 The water content of the snowpack in the Tuolumne drainage is 57% of average; in the Merced drainage it is 63% of average.
April 1, 2016 snow surveys showed water content of the snowpack in the Tuolumne drainage at 89% of average; in the Merced drainage at 91% of average. According to the park “The April 1 survey is considered the benchmark for the year; the water content of the snowpack typically peaks near this date.”
March 1, 2016 snow surveys showed water content of the snowpack in the Tuolumne drainage at 101% of average; in the Merced drainage at 89% of average.
Feb. 1, 2016 snow surveys showed water content for the Merced river drainage at 105% of average and the Tuolumne drainage at 132% of average.
May 1, 2015 snow surveys showed water content for the Merced river drainage at 0% of average and the Tuolumne drainage at 3% of average.
April 1, 2015 snow surveys showed water content for the Merced river drainage at 2% of average and the Tuolumne drainage at 7% of average.
March 1, 2015 snow surveys showed water content for the Merced river drainage at 12% of average and the Tuolumne drainage at 16% of average.
Feb. 1, 2015 snow surveys showed water content for the Merced river drainage at 21% of average and the Tuolumne drainage at 22% of average.
May 1, 2014 snow surveys showed water content for the Merced river drainage at 15% of average and the Tuolumne drainage at 25% of average.
April 1, 2014 snow surveys showed water content for the Merced river drainage at 28% of average and the Tuolumne drainage at 33% of average.
April 1, 2013 snow surveys showed water content for the Merced river drainage at 53% of average and the Tuolumne drainage at 52% of average.
March 1, 2013 snow surveys showed water content for the Merced river drainage at 68% of average and the Tuolumne drainage at 70% of average.
May 1, 2012 snow surveys showed water content for the Merced river drainage at 36% of average and the Tuolumne drainage at 26% of average.
April 1, 2012 snow surveys showed water content for the Merced river drainage at 47% of average and the Tuolumne drainage at 43% of average.
Feb.1, 2012 snow surveys showed water content for the Merced river drainage at 29% of average and the Tuolumne drainage at 32% of average.
May 1, 2011 snow surveys showed water content for the Merced river drainage at 199% of average and the Tuolumne drainage at 184% of average.
April 1, 2011 snow surveys showed water content for the Merced river drainage at 172% of average and the Tuolumne drainage at 178% of average.
Feb. 1, 2011 snow surveys showed water content for the Merced river drainage at 142% of average and the Tuolumne drainage at 149% of average.
Feb. 1, 2010 snow surveys showed water content for the Merced river drainage at 107% of average and the Tuolumne drainage at 117% of average.
March 1, 2010 snow surveys showed water content for the Merced river drainage at 102% of average and the Tuolumne drainage at 111% of average.
June 7, 2010 the Merced River had it’s highest recorded flow on that date from 93 years of records.
May 1, 2010 saw the Tuolumne drainage at 141% of normal and the Merced drainage at 134% of normal.
April 1, 2009 The Tuolumne drainage has 92% of average water content and the Merced drainage has 93% of average.
The March 1, 2009 snow surveys reported “90% of average water content for the Tuolumne drainage and 84% of average for the Merced drainage.”
The February 2008 snow surveys found the “Tuolumne drainage at 133% of average and
the Merced drainage at 125% of average … -most of the lower elevation courses in the
Tuolumne drainage are already well above 100% of their April 1 average.
The snowiest course this month was Wilma Lake, with 9 1/2 feet of snow and
36″ of water. (M. Fincher – 2/8/08)”
The March 1, 2007 snow surveys found that snow (water content) is at 63% of average in the Tuolumne River basin and 66% of average in the Merced River basin.
—————————-
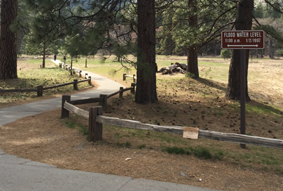
As you walk from the far side of the parking lot at free Yosemite shuttle bus stop #11, towards Cook’s Meadow, you may see a sign showing the depth of the water at that location during the 1997 flood:
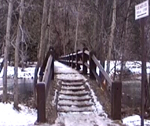
Below: at a bridge over the Merced river in Yosemite Valley, the line on the sign in the upper right of this winter photo shows the water depth (water level) during the January 1997 Yosemite valley flood:
That sign is gone now, but was replaced by a metal sculpture worth looking for. At Yosemite valley free shuttle bus stop #6, Yosemite falls, looking across the road you can see a path leading to a bridge over the river. When you first step up on to the bridge, on the left hand side, there is a metal sculpture showing the depths of the water various years Yosemite Valley has flooded. It is amazing to stand on the bridge and see when Yosemite valley became a lake. Yes, the entire bridge has been under water at times.
Other directions to find the bridge and sculpture are at Cook’s Meadow.
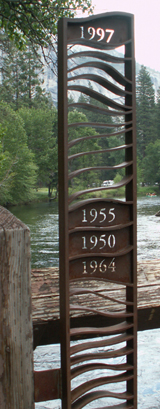
See details and more pictures at Yosemite floods display on Superintendent’s Bridge.
(If this display were to be removed, you can still visualize the depth of the water by seeing that a person 5 feet tall standing on the bridge would be, in effect, under water during the 1997 flood.)
—————————-
From a May, 2006 Yosemite daily report, the peak time of day for flooding in Yosemite valley:
“The Merced River has a distinct daily peak at about 1am every day and a
daily low at about 1pm every day, and it is almost always either rising or
falling during spring runoff if you are watching it over the course of a
few hours.”
In a May 15, 2006 Daily Report, the order in which parts of Yosemite valley flood as the river rises:
“HISTORICALLY…WHEN FORECAST OR OBSERVED STAGE AT POHONO BRIDGE
REACHES 10.0 FEET…WESTERN PORTION OF NORTH PINES CAMPGROUND…
LOCATED AT THE EAST END OF YOSEMITE VALLEY BETWEEN THE CONFLUENCE
OF THE MERCED RIVER AND TENAYA CREEK…BEGINS TO FLOOD. WATER RISES
TO THE BASE OF THE SWINGING BRIDGE DOWNSTREAM FROM CHAPEL MEADOW.
WHEN FORECAST OR OBSERVED STAGE AT POHONO BRIDGE REACHES 10.5 FEET…
WATER TOPS THE SWINGING BRIDGE DOWNSTREAM FROM CHAPEL MEADOW.
OVERFLOW FROM WOSKI POND FLOODS ACCESS ROAD(NORTHSIDE DRIVE) LEADING
OUT OF THE WEST ENTRANCE OF THE PARK.”
—————————-
Spring Runoff 2006, from a March 1 Yosemite Daily Report
Monday’s high water on the Merced was one of the highest flows for this
time of year ever recorded. Flows at Pohono Bridge topped 4400 cubic feet
per second (cfs) with a stage of 8.3 feet, just 1.7 feet shy of flood
stage. Was this the beginning of spring runoff or just an odd
meteorological event? Keep up with the latest river and weather conditions
in Yosemite by using the following online resources:
Real-time flow at Happy Isles and Pohono Bridge USGS Gaging Stations:
http://cdec.water.ca.gov/river/mercedStages.html
See also the river forecast for the Merced River at Pohono Bridge at
http://www.cnrfc.noaa.gov/graphicalRVF.php?id=POHC1
————- – – – – – – – – – —————-
Real-time weather and snowpack information is available for many stations
in Yosemite:
Tioga Pass:
http://cdec2.water.ca.gov/cgi-progs/queryFx?s=tes&d=now&span=12hours
Dana Meadows:
http://cdec.water.ca.gov/cgi-progs/queryFx?s=dan&d=now&span=12hours
Tuolumne Meadows:
http://cdec2.water.ca.gov/cgi-progs/queryFx?s=tum&d=now&span=12hours
Tenaya Lake:
http://cdec2.water.ca.gov/cgi-progs/queryFx?s=tny&d=now&span=12hours
Gin Flat: http://cdec.water.ca.gov/cgi-progs/queryFx?GIN
Crane Flat (Doghouse Meadow):
http://cdec2.water.ca.gov/cgi-progs/queryFx?DGH
Yosemite Valley: http://cdec2.water.ca.gov/cgi-progs/queryFx?YYV
Ostrander Lake:
http://cdec2.water.ca.gov/cgi-progs/queryFx?s=str&d=now&span=12hours
Wawona: http://cdec2.water.ca.gov/cgi-progs/queryFx?YOW
Lower Kibbie Ridge:
http://cdec2.water.ca.gov/cgi-progs/queryFx?s=kib&d=now&span=12hours
Paradise Meadow:
http://cdec.water.ca.gov/cgi-progs/queryFx?s=pds&d=now&span=12hours
————- – – – – – – – – – —————-
The start of a hike to Mirror Lake, the trail along the cliffs, (across the parking lot from the Ahwahnee hotel) in some months, you can see and feel mist from the Royal Arch Cascades. When the valley is nearing flooding, or sometimes just in heavy rain, this section of trail can become an unsafe creek/river!
(Photos below from February 2017 – the white is not snow, it is rushing water.)
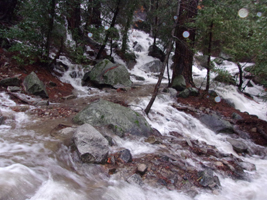
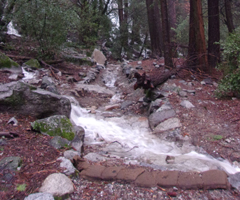
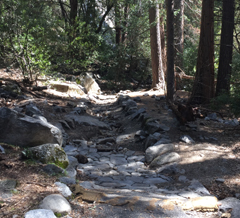
Compare the photo above to April 2017:
————- – – – – May 16, 2005 Flood – – – – – —————-
From the Yosemite Daily Report: (2005) “Park personnel have completed the April 1 snow surveys. This is the benchmark survey for the year, with the results used to determine water allocations for the year. Both the Merced and Tuolumne drainages have 163% of average water content. The lower elevation courses are disproportionately deep this year. 2005 is the 7th wettest season on record for the park (for 4/1). The top six years: 1983, 1969, 1952, 1995, 1978, and 1993. While it is tempting to predict an opening date for the Tioga Road based on this data, potential prognosticators should be aware that, historically, the 4/1 snowpack and the Tioga Road opening date are not well correlated. The opening date is better correlated to spring temperatures. 1978, 1993, and 1998 had snowpacks with water content similar to this year. In 78 and 93, the road opened June 3. In 98, average temperatures for April, May, and June were 6-9 degrees lower than in 78 and 93 and the road opened on July 1.”
The May 1, 2005 snow survey had the pack at 179% of average, about halfway between the 1983 record snowpack and the long-term average.
Warm spring weather and rain caused some of this 2005 snowpack to flood Yosemite valley again on May 16, 2005 and close all roads into and out of the valley for a short time. On May 17, high water levels peaked at about 11 feet, 6 inches in Yosemite Valley at about 5:00 PM.
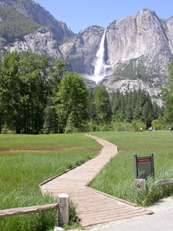
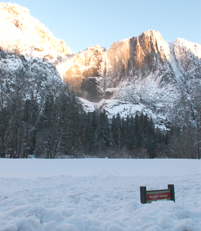
In the NPS photo of flooded Sentinel Meadow taken May 16, 2005, you can just make out the sunken edge of the boardwalk across the meadow between the two posts on the fence and can just see Yosemite Falls thru the low clouds in the background. Next to it is the same place in June, 2005 and again in February 2008
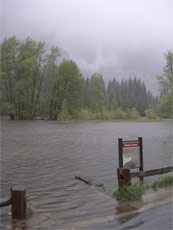
For weeks after this the roads flooded again and again. About one third of the units at Housekeeping camp were damaged.
The National Weather Service issued and reissued this warning:
…A FLOOD WARNING REMAINS IN EFFECT FOR THE MERCED RIVER AT POHONO BRIDGE…
SNOWMELT HAS PRODUCED ADDITIONAL RISES TO FLOOD STAGE THIS EVENING ALONG THE UPPER MERCED RIVER AT POHONO BRIDGE. ADDITIONAL RISES ARE EXPECTED OVERNIGHT.
HISTORICALLY…WHEN FORECAST OR OBSERVED STAGE AT POHONO BRIDGE REACHES 10.0 FEET…WESTERN PORTION OF NORTH PINE CAMPGROUND…LOCATED AT THE EAST END OF YOSEMITE VALLEY BETWEEN THE CONFLUENCE OF THE MERCED RIVER AND TENAYA CREEK BEGINS TO FLOOD. WATER RISES TO THE BASE OF THE SWINGING BRIDGE DOWNSTREAM FROM CHAPEL MEADOW.
WHEN FORECAST OR OBSERVED STAGE AT POHONO BRIDGE REACHES 10.5 FEET…WATER TOPS THE SWINGING BRIDGE DOWNSTREAM FROM CHAPEL MEADOW. OVERFLOW FROM WOSKI POND FLOODS ACCESS ROAD (NORTHSIDE DRIVE) LEADING OUT OF THE WEST ENTRANCE OF THE PARK.”
The Park Service said: “Flooding is a natural process in Yosemite National Park. High snow levels this winter, combined with unsettled spring weather patterns, indicate that flooding may occur. Visitors are advised to check the web site www.nps.gov/yose , or call 209/372-0200 for current weather conditions”
————- – – – – – – – – – —————-
Find a chart of mid-May to mid-June peak spring flows and many other stats:
http://www.nps.gov/yose/learn/nature/flooding.htm
————- – – – – – – – – – —————-
Current and previous rain/snowfall statistics for California can be found at:
http://cdec.water.ca.gov/snow_rain.html
————- – – – – – – – – – —————-
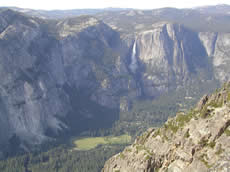
In the NPS photo below, taken from Taft Point on May 15, 2004, we can see lots of water flow from Yosemite Falls, but we can also see that the cliffs, hills of the Yosemite Falls drainage are practically free of snowpack.
From the Daily Report of Thursday, June 5, 2003
Recent Flooding
If you’ve visited the Valley recently you’ve undoubtedly noticed the
booming spring runoff. How booming is it? Hydrologists quantify flood
events, even if they’re only annual spring “floods”, in probabilities. For
example, a 100-year flood has a 1-in-100 chance of happening each year (to
call it “a flood that happens only once every 100 years” is technically
incorrect . . . just as flipping a coin 10 times you could get all heads,
we could have two 100-year floods in back-to-back years, its just very
unlikely). Similarly, we have a 1-in-10, or 10%, chance of seeing at least
a 10-year flood in 2004.
The Merced River in the Valley peaked this year on May 29th at 1:45 AM,
with 4,550 cubic feet of water flowing past Happy Isles every second. These
numbers come from the USGS Happy Isles gauging station, one of the oldest
in the US with 88 years of data. Calculations based on this long-running
dataset show that this year’s spring runoff is a 6-year flood event. The
last time we had a flood greater than this was the roughly 89-year flood in
1997. The ’97 flood was a winter rain-on-snow event . . . the last time
that we had spring runoff exceeding 2003’s was on May 16th, 1996, when the
Merced at Happy Isles peaked at 5,900 cubic feet per second. Below are the
top 20 floods recorded at Happy Isles:
Recurrence Interval in years Date Instantaneous Peak in cubic feet per second
89 1/2/97 10100*
45 12/23/55 9860*
30 11/18/50 9260*
22 12/23/64 9240*
18 12/11/37 8400*
15 5/16/96 5900
13 5/29/83 5450
11 7/9/95 5220
10 2/1/63 5200*
9 6/3/69 4980
8 4/11/82 4880
7 6/2/75 4650
7 6/30/67 4640
6 5/29/03 4550
6 5/31/73 4240
6 6/9/78 4190
5 6/16/98 4150
5 1/13/80 4040*
5 5/31/86 4040
4 5/28/19 3800
———————————————————-
Video of the floods of 1996 and 1997:
https://www.nps.gov/media/video/view.htm?id=EA81A54A-CB4D-410C-6BCB1393E86F108A
———————————————————–
PEAK YOSEMITE VALLEY WATERFALL FLOW
for 2003 was at the end of May.
In the Yosemite National Park Daily Report of Friday, May 30, 2003 we read
“What a spectacular year!! This is the day or weekend to get out and check
it out!
Per the hydrologists at the California Department of Water Resources, the
snowpack generally is melting at a rate of 1″ or more a day (Tuolumne staff
says they are losing up to 1.5 inches/day). Although more than 1/2 of the
April 1 average pack is gone, the remaining central Sierra snowpacks are
still well above average for this time of year. Snowmelt run-off has peaked
in Northern California and the Tahoe/Truckee river basins, and is peaking
in the Central and Southern Sierra rivers in the next few days (I think
USGS is predicting today or tomorrow).
At Happy Isles, the gage depth at 8:00 this morning was 7.66′, and the
prediction for today at the Happy Isles gauging station is for the water to
peak at 2 a.m. at 4,460 CFS (cubic feet second!) with a low at 4:00 pm at
about 2,600 CFS. To put the year into perspective, at 8:00 this morning,
the flow was 4,110 CSF, and the 85 year mean is 1,413 CFS . (Boyers)”
During the last week of May there was some flooding in the campgrounds. “The upper end of Yosemite Valley is in the midst of a minor, approximately 5- to 10- year flood”
To see the water flow at Happy Isles where the section of the Merced River that fills Vernal and Nevada falls enters the valley, click on this webcam link:
http://ca.water.usgs.gov/webcams/happyisles/
You can also find a Weekly Video & Image Archive.
The U.S. Geological Survey maintains stream gages along the Merced River in two locations in Yosemite Valley. The info for today and/or this year, with the median daily streamflow based on over 80 years of record (the little triangles you will see on the chart) is at:
USGS Yosemite Valley stream gages
![]()
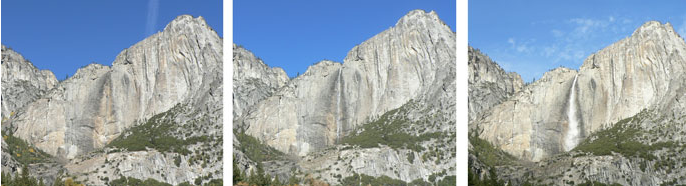
The Yosemite valley waterfalls dry up over the summer and are replenished by fall and early winter rains. A December 4, 2012 volunteer interpreter blog said this:
” . . . Yosemite Falls may have been flowing by Thanksgiving, but it’s not really back until the roar of water announces the return. Strong rainstorms over the past week have brought more than six inches of rain to the lower elevations of Yosemite, making even the smallest drainages fill with the water that flows and tumbles down the Valley walls. The drastic change that Yosemite Falls has undergone in less than one month is amazing, captured in these photographs taken over the past four weeks. . . ”
and offered three photos:
How much water will there be in the Yosemite waterfalls?
Webcam of Yosemite Falls https://yosemite.org/webcams/yosemite-falls/
You can buy a Yosemite waterfall tshirt, poster or art work online from the Yosemite Conservancy https://shop.yosemite.org/
Paintings of Yosemite https://www.nps.gov/yose/learn/historyculture/paintings-of-yosemite.htm
places to take photos of Half Dome in Yosemite National Park (with maps)
places to take photos of Yosemite Falls in Yosemite National Park (with maps)
Places to take photos of El Capitan in Yosemite National Park, (with maps)
Places to take photos of Staircase Falls in Yosemite National Park
Places to take photos of Bridalveil Fall in Yosemite National Park
——————————————————————-
The author of this webpage, (written as a reading assignment for my students), does not give any warranty, expressed or implied, nor assume any legal liability or responsibility for the accuracy, completeness, or usefulness of any information, product, or process included in this website or at websites linked to or from it. Users of information from this website assume all liability arising from such use.